Page 86 - 《橡塑技术与装备》英文版2026年1月
P. 86

HINA R&P  TECHNOLOGY  AND EQUIPMENT


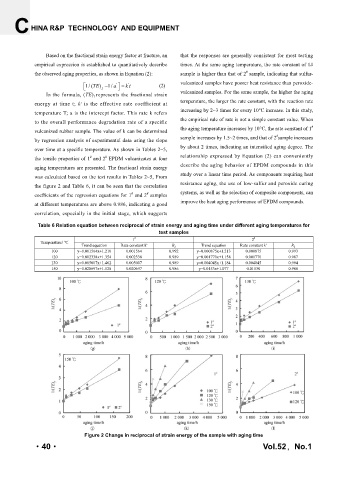
                 Based on the fractional strain energy factor at fracture, an   that the responses are generally consistent for most testing
                                    (T ×  E  ) before aging
                                      b
                                         b
             empirical expression is established to quantitatively describe   times. At the same aging temperature, the rate constant of 1#
                                   =
                             (
                              TE) f
                                    (T ×  E b )
                                      b
                                           after aging
             the observed aging properties, as shown in Equation (2):  sample is higher than that of 2  sample, indicating that sulfur-
                                                                                      #
                                                               vulcanized samples have poorer heat resistance than peroxide-
                              
                                             1/ (TE ) − 1/ a  = k t                      (2)
                                             '
                                         '
                              
                                          
                                    f
                 In the formula, (TE) f  represents the fractional strain   vulcanized samples. For the same sample, the higher the aging
                              ln k = − (E  / RT +  ln A        temperature, the larger the rate constant, with the reaction rate
                                          )
             energy at time t; k' is the effective rate coefficient at
                                     a
                                                               increasing by 2~3 times for every 10°C increase. In this study,
             temperature T; a is the intercept factor. This rate k refers
                                   ) −
                              1/ (TE
                              
                                            k t
                                         '
                                      1/ a  =
                                             '
                              
                                          
                                    f
             to the overall performance degradation rate of a specific   the empirical rule of rate is not a simple constant value. When
                                      '
                                             ln '
                                 '
                                     E
                                       / RT +
                                              A
                                                                                                            #
                                          )
                              ln k = −(
             vulcanized rubber sample. The value of k can be determined   the aging temperature increases by 10°C, the rate constant of 1
                                      a
                                                                                                #
                                                               sample increases by 1.5~2 times, and that of 2 sample increases
             by regression analysis of experimental data using the slope
                                       '
                                                '
                                 
                                                       '
                                                      E
                                               A
                                         1/ a ÷
                               ' t =
                                       f −
                                                 exp −
                                 1/ (TE)
                                                        / RT)
                                                   (
                                            
                                 
                                                       a
             over time at a specific temperature. As shown in Tables 2~5,   by about 2 times, indicating an intensified aging degree. The
                                     #
             the tensile properties of 1  and 2  EPDM vulcanizates at four   relationship expressed by Equation (2) can conveniently
                                #
             aging temperatures are presented. The fractional strain energy   describe the aging behavior of EPDM compounds in this
             was calculated based on the test results in Tables 2~5, From   study over a linear time period. As components requiring heat
             the figure 2 and Table 6, it can be seen that the correlation   resistance aging, the use of low-sulfur and peroxide curing
             coefficients of the regression equations for 1  and 2  samples   systems, as well as the selection of composite components, can
                                                    #
                                              #
                                                               improve the heat aging performance of EPDM compounds.
             at different temperatures are above 0.986, indicating a good
             correlation, especially in the initial stage, which suggests
              Table 6 Relation equation between reciprocal of strain energy and aging time under different aging temperatures for
                                                        test samples
                                               1 #                                      2 #
               Temperature/ ℃
                             Trend equation  Rate constant k'  R 2    Trend equation  Rate constant k'  R 2
                   100      y=0.001564x+1.210  0.001564    0.992     y=0.000875x+1.213  0.000875    0.993
                   120      y=0.002338x+1.354  0.002338    0.989     y=0.001770x+1.158  0.001770    0.987
                   130      y=0.005007x+1.462  0.005007    0.989     y=0.004045x+1.184  0.004045    0.994
                   150      y=0.020697x+1.128  0.020697    0.986     y=0.0153x+1.077  0.01530       0.988
                              Figure 2 Change in reciprocal of strain energy of the sample with aging time
             ·40·                                                                          Vol.52,No.1
   81   82   83   84   85   86   87   88   89   90   91