
Page 67 - 《橡塑技术与装备》英文版2026年3期
P. 67
THEORY AND RESEARCH
data basis for accurately determining the type of nylon in
sample 2.
Figure 2 Structural formula and mass spectrum of nylon
6 and its sample
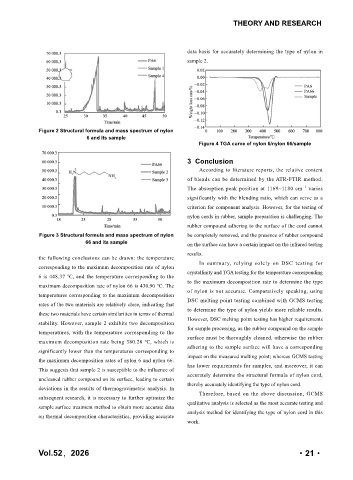
Figure 4 TGA curve of nylon 6/nylon 66/sample
3 Conclusion
According to literature reports, the relative content
of blends can be determined by the ATR-FTIR method.
-1
The absorption peak position at 1169~1180 cm varies
significantly with the blending ratio, which can serve as a
criterion for component analysis. However, for the testing of
nylon cords in rubber, sample preparation is challenging. The
rubber compound adhering to the surface of the cord cannot
Figure 3 Structural formula and mass spectrum of nylon be completely removed, and the presence of rubber compound
66 and its sample on the surface can have a certain impact on the infrared testing
results.
the following conclusions can be drawn: the temperature
corresponding to the maximum decomposition rate of nylon In summary, relying solely on DSC testing for
crystallinity and TGA testing for the temperature corresponding
6 is 448.37 ℃, and the temperature corresponding to the
to the maximum decomposition rate to determine the type
maximum decomposition rate of nylon 66 is 430.90 ℃. The
temperatures corresponding to the maximum decomposition of nylon is not accurate. Comparatively speaking, using
rates of the two materials are relatively close, indicating that DSC melting point testing combined with GCMS testing
to determine the type of nylon yields more reliable results.
these two materials have certain similarities in terms of thermal
However, DSC melting point testing has higher requirements
stability. However, sample 2 exhibits two decomposition
temperatures, with the temperature corresponding to the for sample processing, as the rubber compound on the sample
surface must be thoroughly cleaned, otherwise the rubber
maximum decomposition rate being 380.28 ℃, which is
adhering to the sample surface will have a corresponding
significantly lower than the temperatures corresponding to
the maximum decomposition rates of nylon 6 and nylon 66. impact on the measured melting point; whereas GCMS testing
has lower requirements for samples, and moreover, it can
This suggests that sample 2 is susceptible to the influence of
accurately determine the structural formula of nylon cord,
uncleaned rubber compound on its surface, leading to certain
deviations in the results of thermogravimetric analysis. In thereby accurately identifying the type of nylon cord.
Therefore, based on the above discussion, GCMS
subsequent research, it is necessary to further optimize the
qualitative analysis is selected as the most accurate testing and
sample surface treatment method to obtain more accurate data
analysis method for identifying the type of nylon cord in this
on thermal decomposition characteristics, providing accurate
work.
Vol.52,2026 ·21·