
Page 66 - 《橡塑技术与装备》英文版2026年3期
P. 66
HINA R&P TECHNOLOGY AND EQUIPMENT
point tests on nylon 6, nylon 66, and four unknown samples, misjudgments in practical identification. Therefore, relying
the DSC melting point test graph shown in Figure 1 was solely on crystallinity to identify the type of cord in tires is not
obtained. feasible.
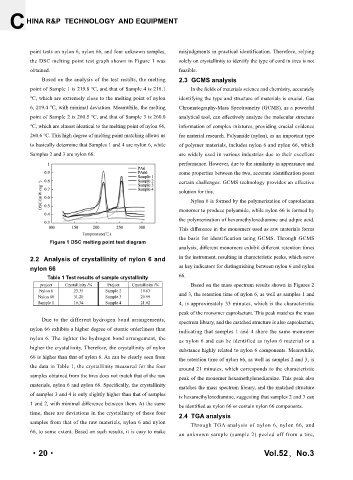
Based on the analysis of the test results, the melting 2.3 GCMS analysis
point of Sample 1 is 219.8 ℃, and that of Sample 4 is 218.1 In the fields of materials science and chemistry, accurately
℃, which are extremely close to the melting point of nylon identifying the type and structure of materials is crucial. Gas
6, 219.4 ℃, with minimal deviation. Meanwhile, the melting Chromatography-Mass Spectrometry (GCMS), as a powerful
point of Sample 2 is 260.5 ℃, and that of Sample 3 is 260.0 analytical tool, can effectively analyze the molecular structure
℃, which are almost identical to the melting point of nylon 66, information of complex mixtures, providing crucial evidence
260.6 ℃. This high degree of melting point matching allows us for material research. Polyamide (nylon), as an important type
to basically determine that Samples 1 and 4 are nylon 6, while of polymer materials, includes nylon 6 and nylon 66, which
Samples 2 and 3 are nylon 66. are widely used in various industries due to their excellent
performance. However, due to the similarity in appearance and
some properties between the two, accurate identification poses
certain challenges. GCMS technology provides an effective
solution for this.
Nylon 6 is formed by the polymerization of caprolactam
monomer to produce polyamide, while nylon 66 is formed by
the polymerization of hexamethylenediamine and adipic acid.
This difference in the monomers used as raw materials forms
the basis for identification using GCMS. Through GCMS
Figure 1 DSC melting point test diagram
analysis, different monomers exhibit different retention times
2.2 Analysis of crystallinity of nylon 6 and in the instrument, resulting in characteristic peaks, which serve
nylon 66 as key indicators for distinguishing between nylon 6 and nylon
Table 1 Test results of sample crystallinity 66.
project Crystallinity /% Project Crystallinity /% Based on the mass spectrum results shown in Figures 2
Nylon 6 23.35 Sample 2 19.63
Nylon 66 31.20 Sample 3 20.99 and 3, the retention time of nylon 6, as well as samples 1 and
Sample 1 16.34 Sample 4 21.62 4, is approximately 33 minutes, which is the characteristic
peak of the monomer caprolactam. This peak matches the mass
Due to the different hydrogen bond arrangements, spectrum library, and the matched structure is also caprolactam,
nylon 66 exhibits a higher degree of atomic orderliness than indicating that samples 1 and 4 share the same monomer
nylon 6. The tighter the hydrogen bond arrangement, the as nylon 6 and can be identified as nylon 6 material or a
higher the crystallinity. Therefore, the crystallinity of nylon substance highly related to nylon 6 components. Meanwhile,
66 is higher than that of nylon 6. As can be clearly seen from the retention time of nylon 66, as well as samples 2 and 3, is
the data in Table 1, the crystallinity measured for the four around 21 minutes, which corresponds to the characteristic
samples obtained from the tires does not match that of the raw peak of the monomer hexamethylenediamine. This peak also
materials, nylon 6 and nylon 66. Specifically, the crystallinity matches the mass spectrum library, and the matched structure
of samples 3 and 4 is only slightly higher than that of samples is hexamethylenediamine, suggesting that samples 2 and 3 can
1 and 2, with minimal difference between them. At the same be identified as nylon 66 or contain nylon 66 components.
time, there are deviations in the crystallinity of these four 2.4 TGA analysis
samples from that of the raw materials, nylon 6 and nylon Through TGA analysis of nylon 6, nylon 66, and
66, to some extent. Based on such results, it is easy to make
an unknown sample (sample 2) peeled off from a tire,
·20· Vol.52,No.3