
Page 22 - 《橡塑技术与装备》英文版2025年12月
P. 22
HINA R&P TECHNOLOGY AND EQUIPMENT
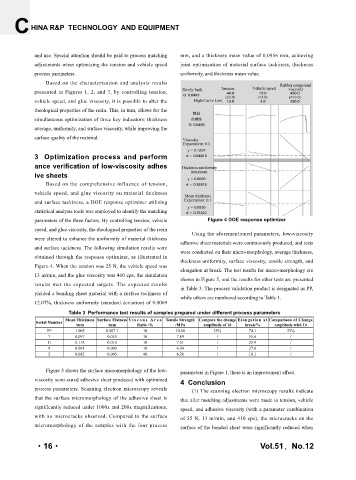
and use. Special attention should be paid to process matching mm, and a thickness mean value of 0.0956 mm, achieving
adjustments when optimizing the tension and vehicle speed joint optimization of material surface tackiness, thickness
process parameters. uniformity, and thickness mean value.
Based on the characterization and analysis results
presented in Figures 1, 2, and 3, by controlling tension,
vehicle speed, and glue viscosity, it is possible to alter the
rheological properties of the resin. This, in turn, allows for the
simultaneous optimization of three key indicators: thickness
average, uniformity, and surface viscosity, while improving the
surface quality of the material.
3 Optimization process and perform
ance verification of low-viscosity adhes
ive sheets
Based on the comprehensive influence of tension,
vehicle speed, and glue viscosity on material thickness
and surface tackiness, a DOE response optimizer utilizing
statistical analysis tools was employed to identify the matching
parameters of the three factors. By controlling tension, vehicle Figure 4 DOE response optimizer
speed, and glue viscosity, the rheological properties of the resin
Using the aforementioned parameters, low-viscosity
were altered to enhance the uniformity of material thickness
adhesive sheet materials were continuously produced, and tests
and surface tackiness. The following simulation results were
were conducted on their micro-morphology, average thickness,
obtained through the response optimizer, as illustrated in
thickness uniformity, surface viscosity, tensile strength, and
Figure 4. When the tension was 25 N, the vehicle speed was
elongation at break. The test results for micro-morphology are
13 m/min, and the glue viscosity was 410 cps, the simulation
shown in Figure 5, and the results for other tests are presented
results met the expected targets. The expected results in Table 3. The process validation product is designated as PP,
yielded a bonding sheet material with a surface tackiness of
while others are numbered according to Table 1.
12.07%, thickness uniformity (standard deviation) of 0.0069
Table 3 Performance test results of samples prepared under different process parameters
Mean Thickness Surface Flatness V iscous Ar ea Tensile Strength Compare the change Elongation at Comparison of Change
Serial Number
/mm /mm Ratio /% /MPa amplitude of 1# break/% amplitude with 1#
PP 1.005 0.007 1 10 10.68 35% 74.1 33%
7 0.097 0.010 10 7.89 / 55.6 /
11 0.118 0.010 10 7.51 / 23.9 /
9 0.091 0.009 10 6.99 / 27.0 /
2 0.082 0.005 40 6.28 / 10.1 /
Figure 5 shows the surface micromorphology of the low- parameters in Figure 1, there is an improvement effect.
viscosity semi-cured adhesive sheet produced with optimized 4 Conclusion
process parameters. Scanning electron microscopy reveals (1) The scanning electron microscopy results indicate
that the surface micromorphology of the adhesive sheet is that after matching adjustments were made to tension, vehicle
significantly reduced under 1000x and 200x magnifications, speed, and adhesive viscosity (with a parameter combination
with no microcracks observed. Compared to the surface of 25 N, 13 m/min, and 410 cps), the microcracks on the
micromorphology of the samples with the four process surface of the bonded sheet were significantly reduced when
51
12
·16·
·16· Vol.51,No.12
期
第
卷 第