
Page 19 - 《橡塑技术与装备》英文版2025年12月
P. 19
THEORY AND RESEARCH
surface flatness, viscosity, tensile strength, and elongation inspect the tape and the test area to check if any part of the test
at break of adhesive sheets. Based on this analysis, an material has peeled off from the test sample. If there is any
optimization scheme is proposed to achieve the preparation of peeling, record the area ratio (%) of the peeled-off part. If there
adhesive sheet materials with low viscosity, high flatness, high is no peeling, record it as 0.
tensile strength, and high elongation at break. Mechanical properties: According to GB/T 1040.2-
2006, the tensile strength and elongation at break of the film
1 Experimental part are tested using a universal tensile machine, with 5A standard
1.1 Main materials and equipment specimens selected.
The raw materials used mainly include: PTFE film (76 Microscopic morphology: The microscopic surface
μm), Tianjin Plastics Research Institute; hydrocarbon resin: roughness of the bonded sheet was observed using a SUPPRA
polybutadiene, Beijing Yanshan Petrochemical Co., Ltd.; 55VP field emission scanning electron microscope from Zeiss,
crosslinking agent: dicumyl peroxide (DCP), commercially Germany.
available; and additives such as silane coupling agent and co-
crosslinking agent, commercially available. 2 Analysis of the influence of process
The equipment used mainly includes: a precision parameters on the performance of adhesive
impregnation machine (self-developed, working width 1000 sheets
mm, maximum speed 30 m/min, tension (5~50 N)), a high- 2.1 Microscopic morphology analysis
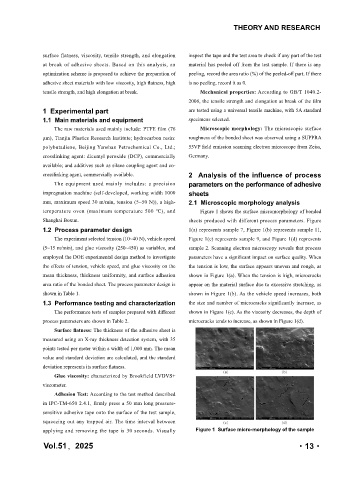
temperature oven (maximum temperature 500 ℃), and Figure 1 shows the surface micromorphology of bonded
Shanghai Boxun. sheets produced with different process parameters. Figure
1.2 Process parameter design 1(a) represents sample 7, Figure 1(b) represents sample 11,
The experiment selected tension (10~40 N), vehicle speed Figure 1(c) represents sample 9, and Figure 1(d) represents
(5~15 m/min), and glue viscosity (250~450) as variables, and sample 2. Scanning electron microscopy reveals that process
employed the DOE experimental design method to investigate parameters have a significant impact on surface quality. When
the effects of tension, vehicle speed, and glue viscosity on the the tension is low, the surface appears uneven and rough, as
mean thickness, thickness uniformity, and surface adhesion shown in Figure 1(a). When the tension is high, microcracks
area ratio of the bonded sheet. The process parameter design is appear on the material surface due to excessive stretching, as
shown in Table 1. shown in Figure 1(b). As the vehicle speed increases, both
1.3 Performance testing and characterization the size and number of microcracks significantly increase, as
The performance tests of samples prepared with different shown in Figure 1(c). As the viscosity decreases, the depth of
process parameters are shown in Table 2. microcracks tends to increase, as shown in Figure 1(d).
Surface flatness: The thickness of the adhesive sheet is
measured using an X-ray thickness detection system, with 35
points tested per meter within a width of 1,000 mm. The mean
value and standard deviation are calculated, and the standard
deviation represents its surface flatness.
Glue viscosity: characterized by Brookfield LVDVS+
viscometer.
Adhesion Test: According to the test method described
in IPC-TM-650 2.4.1, firmly press a 50 mm long pressure-
sensitive adhesive tape onto the surface of the test sample,
squeezing out any trapped air. The time interval between
applying and removing the tape is 30 seconds. Visually Figure 1 Surface micro-morphology of the sample
Vol.51
年,2025
·13·
2025 第 51 卷 ·13·